Imagine! You are making a million-dollar decision and later found it was based on flawed data. This is the daily risk in analytics, where poor quality could have disastrous consequences.
Therefore, in this rapidly evolving data-driven era, the quality of your data profoundly impacts your analytical process and business decisions. High-quality data is not a luxury but a necessity that influences everything connected to the business. So, here is your safeguard: a comprehensive toolkit, a step-by-step guide designed to ensure data quality in the analytical process.
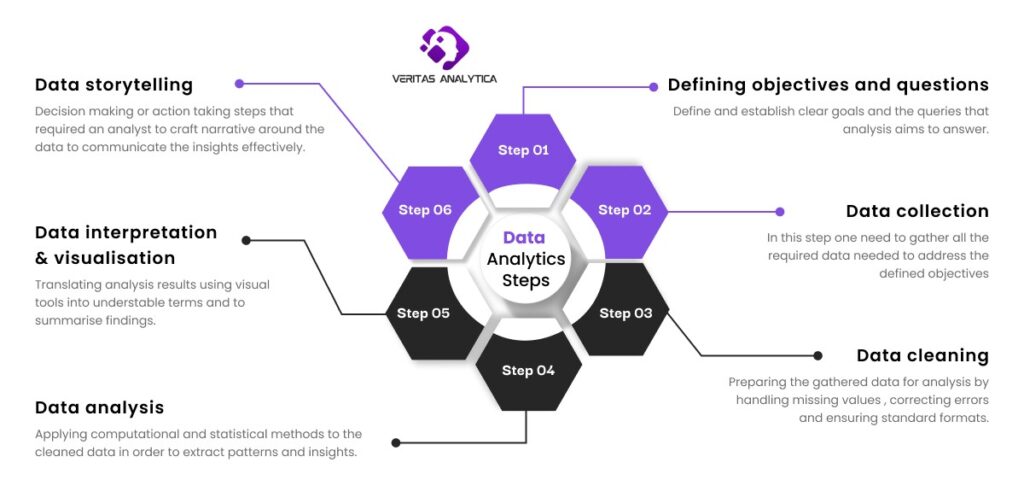
Let’s first concisely streamline the steps needed for analytical processes to create a better flow of understanding.

Importance of Data Quality
The degree to which data satisfies a company’s requirements for validity, completeness, consistency, and accuracy is known as data quality. Checking data quality is important because it directly affects the accuracy and dependability of the information used to make decisions. Hence, reliable data is essential for precise and well-informed decision-making.
Dimensions of Quality Data

How do you use the above dimensions as a reference list to direct data quality:
- Have we achieved an accepted level of accuracy? (Accuracy)
- Is the level of detail adequate? (Precision)
- Have we gathered sufficient information? (Completeness)
- Have we eliminated unnecessary information? (Validity)
- Does the data model link the information to a reliable framework? (Relevancy)
- Was the analysis performed in real-time or in batches? (Timelessness)
- Have we cleaned the data and made it more readable? (Ability to Understand)
- Do we need to perform any further reconciliation checks? (Trustworthiness)
Data Quality Checklist for Data Analytics:
Step 1: Defining Objectives and Questions
Relevancy: Make sure the data you are collecting is directly linked with the research questions and business objectives. For example, if your objective is to improve the customer retention rate, then you need to collect feedback scores, and service interaction feedback scores data rather than supplier inventory level. So, relevant information collection is important.
Validity: The formulated questions to gather data should be logically capable of answering with data. For example, “What factors need to be considered that could lead to increased customer churn?” would be a valid question.
Step 2: Data Collection
Timelessness: Collect the data in the timeframe that ensures its usefulness and relevance. For example, gathering sales information during or right after the busiest selling season will yield the most insightful data for seasonal product analysis.
Accuracy: Make sure the data being collected is precise and correct; for example, using calibrated devices to capture measurements during a production process will guarantee that the numbers are accurate.
Completeness: For a comprehensive view, gather all necessary data points. For example, to guarantee a complete dataset for analysis in a patient health study, gather not just treatment data but also demographic data, medical history, and follow-up results.
Step 3: Data Cleaning
Validity: Ensure that the data conforms to the required rules and formats. For example, ensuring that, prior to an email marketing campaign, every email address is formatted correctly.
Completeness: Addressing gaps in data such as partial data records or missing values, for example, implementing imputation techniques based on the column mean or median to fill in missing values in a dataset in order to improve data consistency.
Accuracy: Correcting any heroes in data such as misclassification or typos, for instance, making spelling corrections to city names in a customer database (e.g., altering ‘New Yrok’ to ‘New York’).
Step 4: Data Analysis
Precision: Minimizing variance using analytical methods that provide precise measurement when required, for instance, predicting financial market trends with a high-precision algorithm, where even tiny percentage changes can have a big impact.
Trustworthiness: Processes and methods should justify confidence and be reliable in the results they produce; for instance, using validated models and established statistical methods in medical research ensures reliable findings and can be trusted by the medical community.
Step 5: Data Interpretation and Visualization
Ability to Understand: Provide information in a way that targeted audiences can understand easily, for instance, presenting annual sales reports in bar charts is more digestible than in scatter plot charts.
Accuracy: Ensuring that there is no distortion of the visualization created and representing the underlying data correctly, for instance, modifying the graph’s scale to avoid any misleading representations of small differences as significant changes.
Step 6: Data Storytelling
Relevancy: The story should highlight observations that are pertinent to the needs and interests of the audience; for instance, imagine presenting a user behavior analytics presentation with a focus on marketing strategies.
Timelessness: Delivering insights in a time frame where they can still influence decision-making; for instance, if you provide the sales forecasting report before the budgeting season begins, this would allow the finance team to allocate resources efficiently.
Trustworthiness: One should be able to rely on the data and analysis used to support the story. For instance, using multiple data sources and cross-validated models to support the claims in business expansion proposals ensures the credibility of predictions.
By meticulously applying these dimensions at each stage, you ensure that the data remains robust, reliable, and actionable throughout its lifecycle.
Conclusion
Hence, to make dependable and accurate business decisions, it is vital to ensure the data quality through each analytical process. The above comprehensive guide, along with different real-time examples elaborated on each step. It is important to ensure data quality before applying data analytics techniques.
To even more simply put the above steps into the easy-to-follow figure, refer to the visual representation below:

Also, if you’re encountering issues in controlling data quality or need specific guidance on enhancing your analytical tactics, don’t hesitate to reach out to Veritas Analytica. Let’s discuss how we can help your business make confident, data-driven decisions.


