Design Holdings is a distinguished leader in the global high-end design sector, celebrated for its sophisticated portfolio of luxury furnishings and lighting brands rooted in European cultural heritage. Driven by the philosophy “We design for a beautiful life,” the company exemplifies commitment to sustainability and innovative design.
Design Holdings faced a significant hurdle: their inventory data was dispersed across multiple warehouses, leading to inaccuracies and inefficiencies. The existing team struggled with delays and errors that hampered operational performance. They needed a robust solution to consolidate and streamline their inventory information, ensuring data such as product names, stock levels, and dates were both accurate and accessible.


The Roadblocks
Despite these obstacles, Veritas Analytica’s collaborative and innovative approach led to a successful resolution.
Features of Our Solution
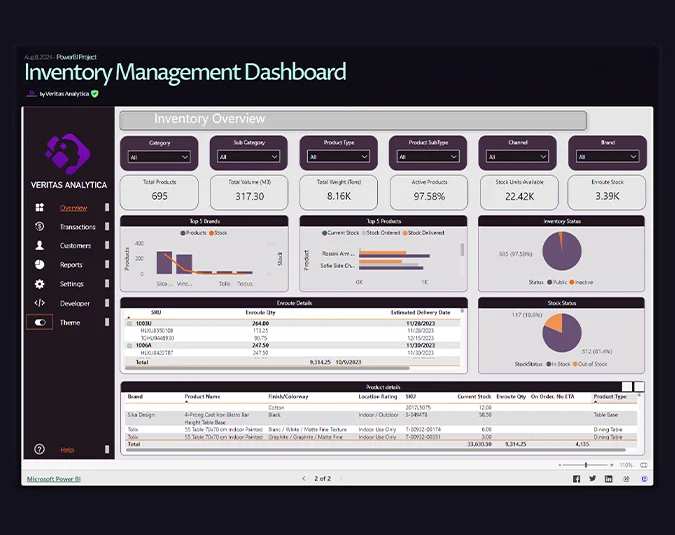
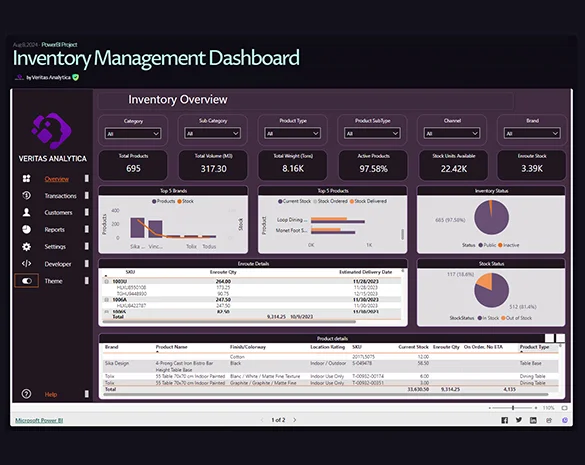
Consolidated Data Visualization
Centralized access to all inventory data across various storage locations.
Advanced Analytics
Identified and managed slow-moving and obsolete stock.
User-Friendly Interface
Simplified data entry and report generation.
Scalable Framework
Accommodated future inventory changes and business growth.

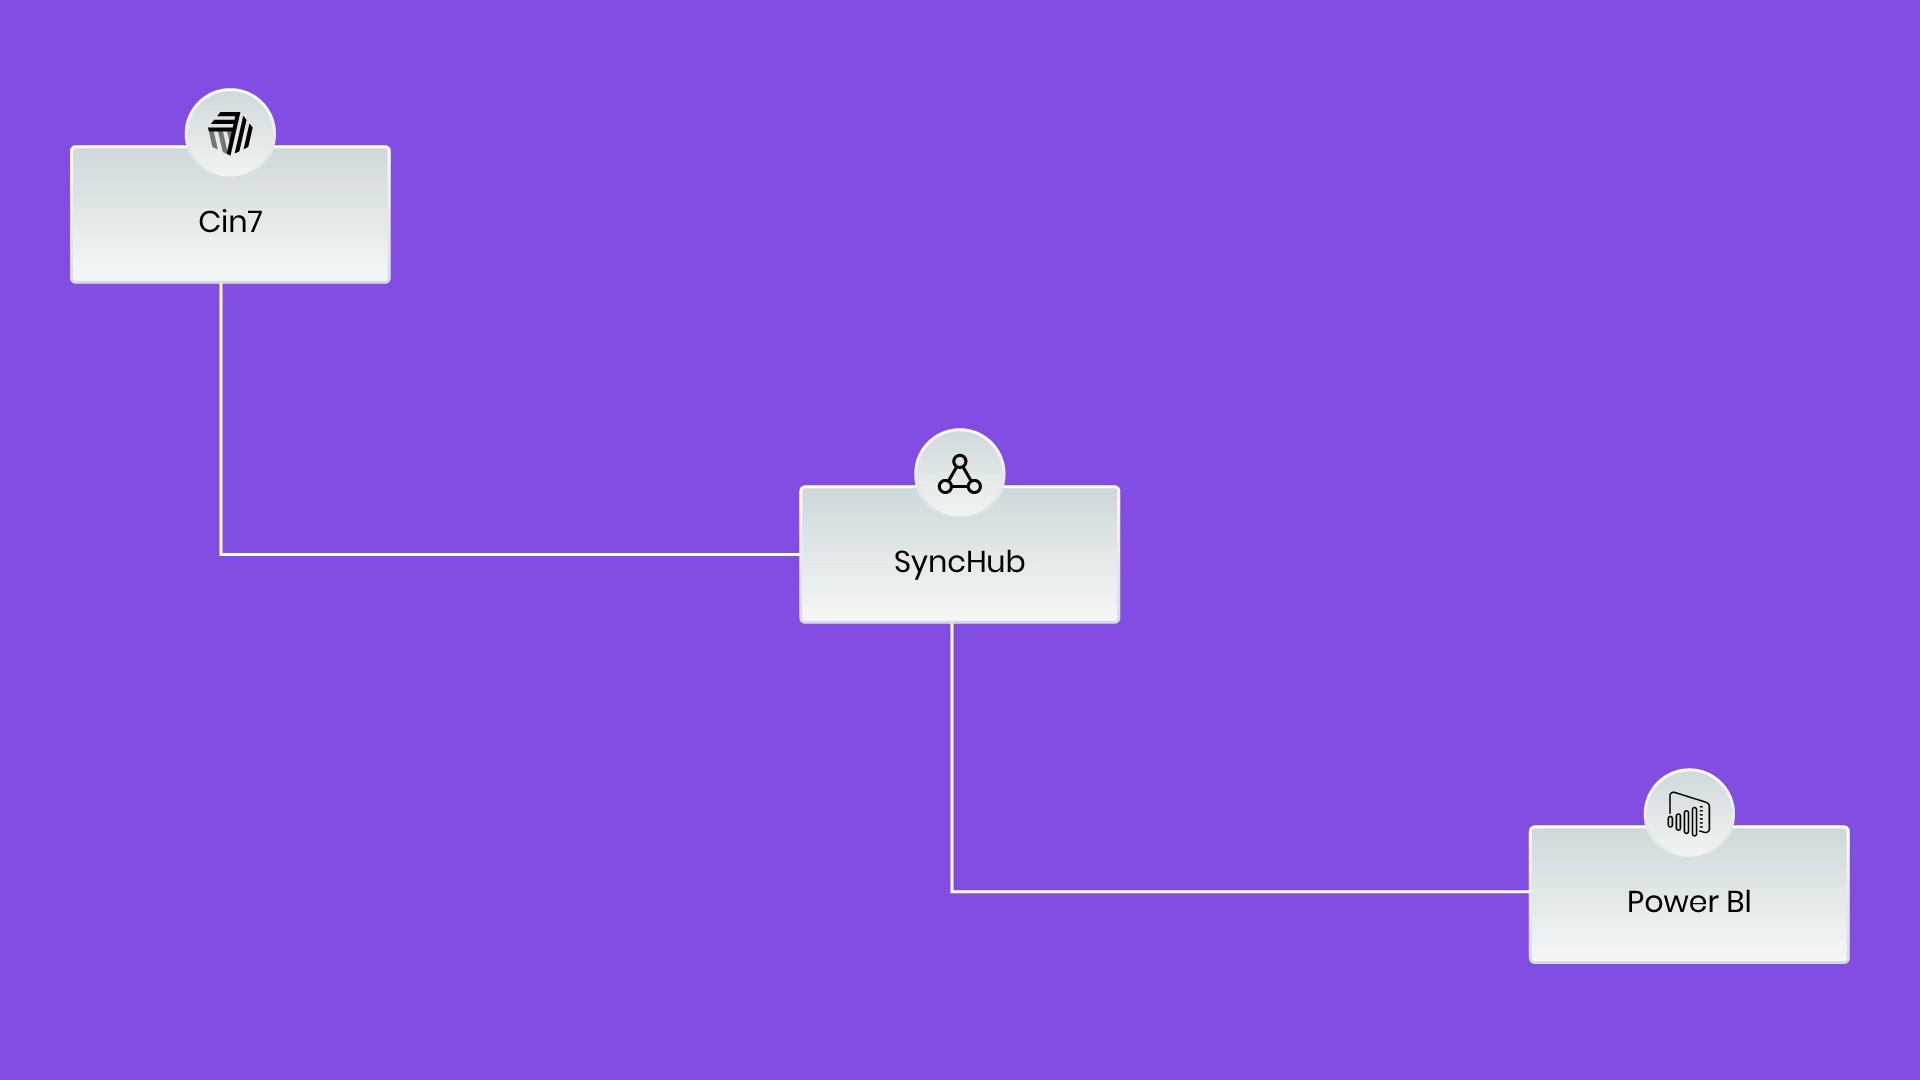
Tech Stack Used
Solution
Consolidated Data Visualization
Centralized access to all inventory data across various storage locations.
Advanced Analytics
Enabled the identification and management of slow-moving and obsolete stock.
User-Friendly Interface
Simplified data entry and intuitive navigation for generating reports on demand.
Scalable Framework
Designed to accommodate future inventory changes and business growth.
Impact


Client Testimonial
Client Name
Designation of Client
Lorem Ipsum is simply dummy text of the printing and typesetting industry. Lorem Ipsum has been the industry’s standard dummy text ever since the 1500s, when an unknown printer took a galley of type and scrambled it to make a type specimen book. Lorem Ipsum is simply dummy text of the printing and typesetting industry. Lorem Ipsum has been the industry’s standard dummy text ever since the 1500s, when an unknown printer took a galley of type and scrambled it to make a type specimen book.
Date: 07/24/2024
We will help you overcome your data and AI challenges.
Call us at +1 206 925 3771.
Email us at [email protected].