


From Data Chaos to Operational Excellence
Powr Digital Sports, a company managing numerous YouTube channels dedicated to different sports, faced a significant challenge. They needed to consolidate and analyze data from all these channels effectively, which proved to be a daunting task.
The Challenge
Powr’s problem was that each YouTube channel operated in isolation, each harboring its own set of data. This isolation posed several challenges:
How Did We Take on the Challenge?
We began by understanding the specific needs and limitations Powr was facing. Our approach involved:


The Roadblocks
During the creation of this tool, several obstacles arose:
Despite these hurdles, continuous testing and problem-solving led to a successful tool.
Features of Our Solution

Script Limits
Utilizing Google Sheets and sophisticated scripts to aggregate data from multiple channels into one centralized location.

Smart Choices
Enhanced understanding of viewer preferences led to improved video content.

Tech Stack Used
FInal Solution

Data Integration
Utilizing Google Sheets and sophisticated scripts to aggregate data from multiple channels into one centralized location.

Data Visualization
Creating detailed charts with Power BI to showcase critical metrics like view counts, likes, and subscriptions.

Easy Filters
Implementing advanced filters in the charts to help Powr identify popular video segments.
Impact

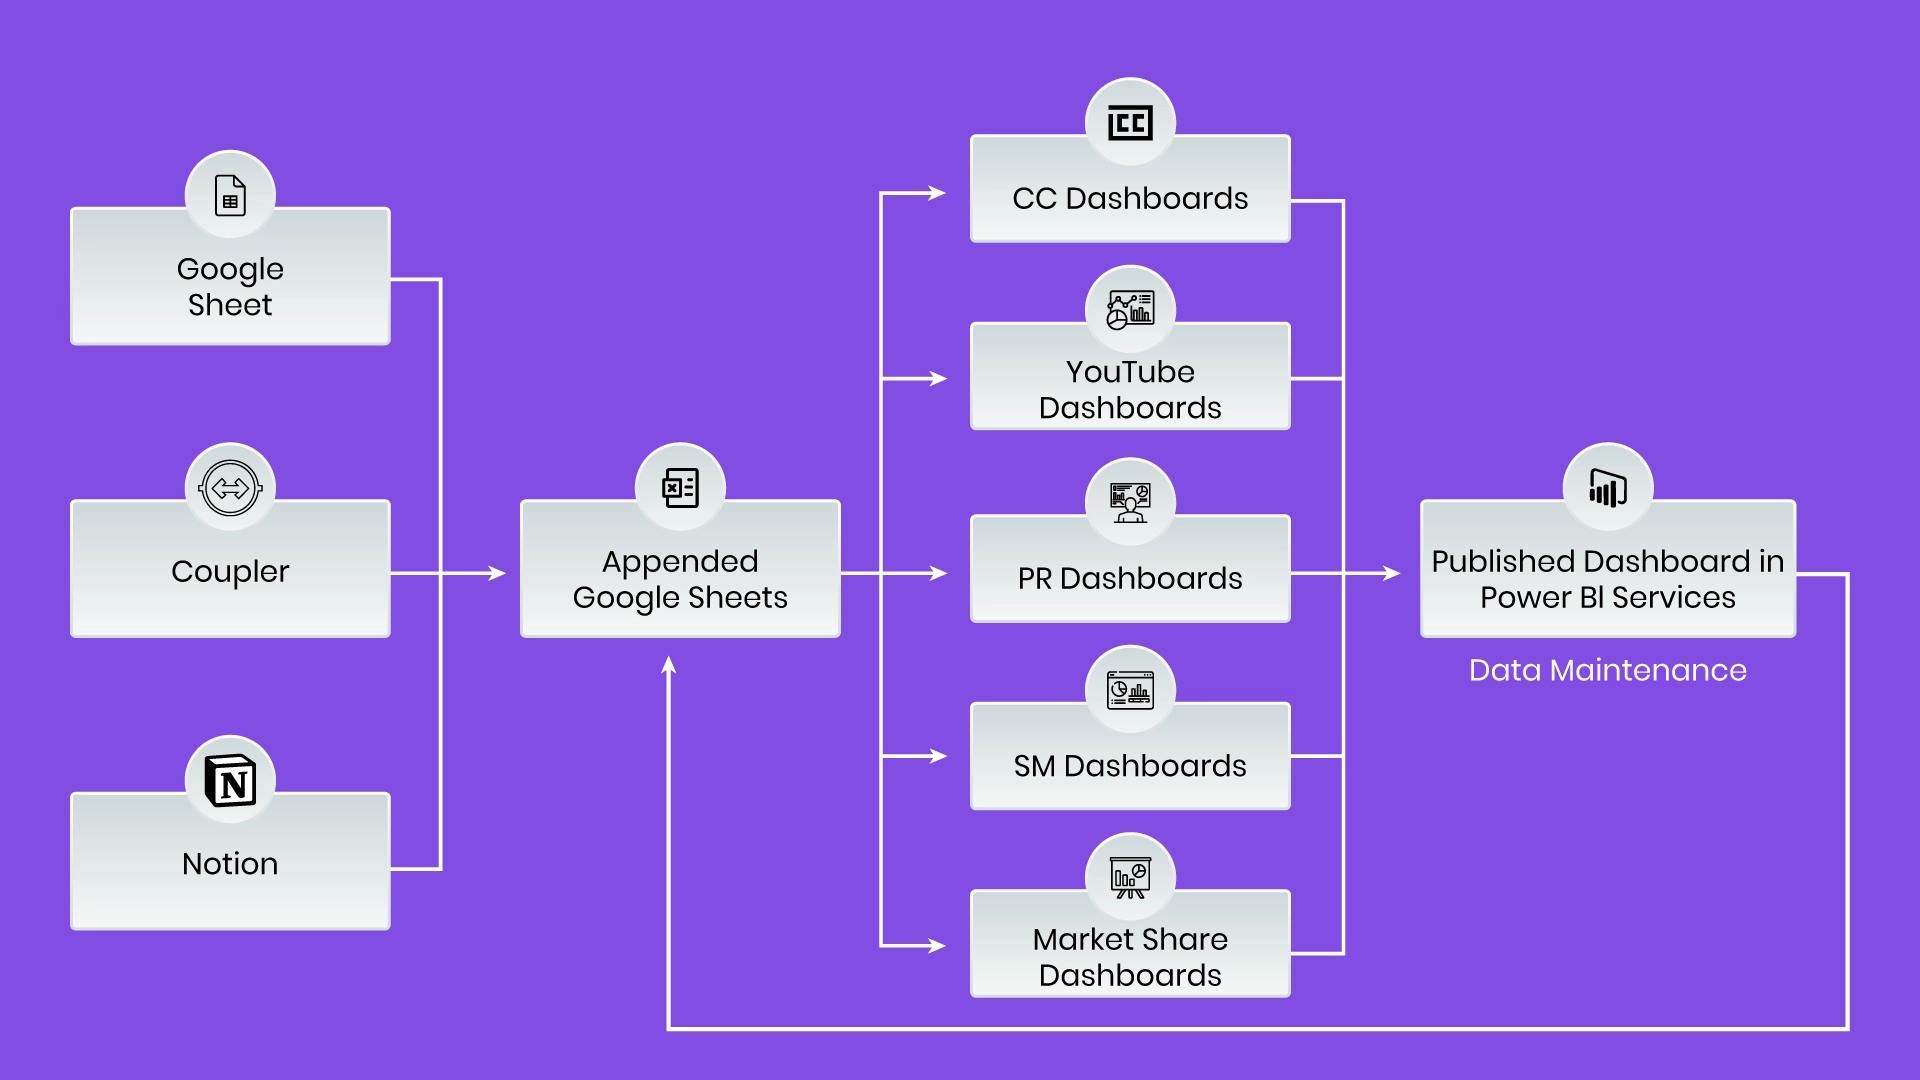
Data Flow Diagram
Client Testimonial

Client Name
Designation of Client
Lorem Ipsum is simply dummy text of the printing and typesetting industry. Lorem Ipsum has been the industry’s standard dummy text ever since the 1500s, when an unknown printer took a galley of type and scrambled it to make a type specimen book. Lorem Ipsum is simply dummy text of the printing and typesetting industry. Lorem Ipsum has been the industry’s standard dummy text ever since the 1500s, when an unknown printer took a galley of type and scrambled it to make a type specimen book.
Date: 07/24/2024
We will help you overcome your data and AI challenges.
Call us at +1 206 925 3771.
Email us at [email protected].