

At some point, most sellers add a second profit tracker, usually because someone in a Facebook group said it was great. Then the numbers don’t match the tool they’ve used all year, and the obvious question comes up: which one is actually right?
Run the same month through Sellerboard, Helium 10 Profits, and Profit Cyclops, and you’ll get three different answers. The strange part is that none of them is wrong.
They just disagree on what “profit” means. And until you know where they split, you’re making pricing, inventory, and ad decisions on a number you can’t fully trust.
Let’s look at how the three differ, and how to pick the one worth trusting
Why Amazon Profit Trackers Show Different Numbers (And Who to Believe)
“Profit” sounds like a fixed number. It isn’t. Every tracker makes a series of accounting choices, and each choice moves the number. Five of those choices cause most of the disagreement.
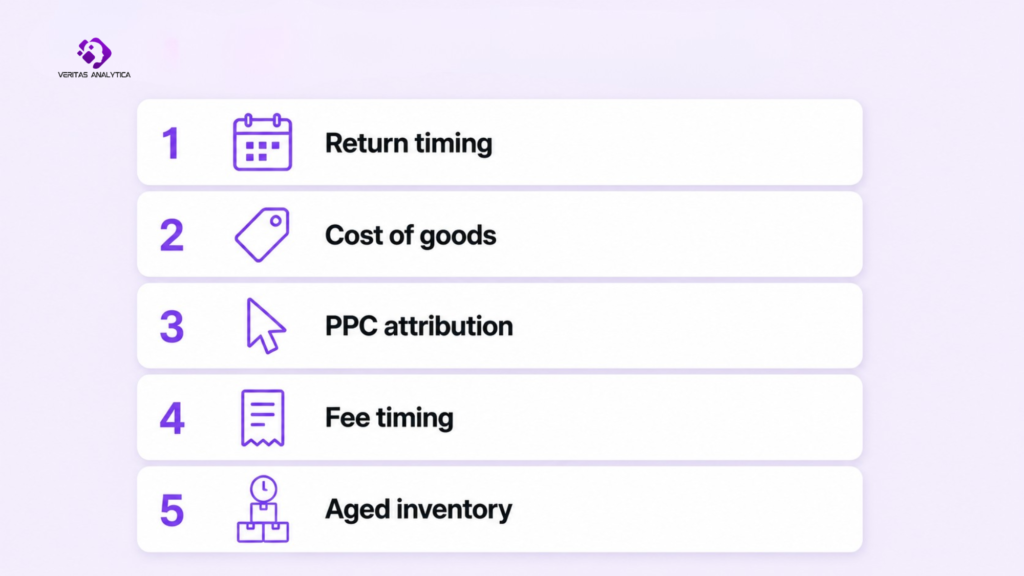
How Return Timing Skews Your Profit Calculations
When a customer makes a purchase in March and then returns the item in April, where does that loss get recorded? Is it in March, when the sale took place, or in April, when the refund is processed? Different tools have varying approaches to this, and that one decision can really impact your financials, especially over 30 days. It’s interesting how a month that initially seemed like a record-breaker can suddenly look less impressive when you take a closer look later on.
COGS Treatment Differences Across Profit Trackers
One thing that often slips people’s minds is that Amazon doesn’t actually see your unit cost. Instead, every tracker relies on the COGS you enter or import from a spreadsheet. After that, things start to vary; some tools record that cost on the sale date, others do it when the item ships, some follow a FIFO method, while others just use a flat average. If you switch suppliers or adjust your unit cost, you might find that two different tools are showing you different margins for the same sale. The truth is, very few people bother to check which method their tool is set to by default, and that’s how discrepancies start to sneak in.
PPC Attribution Windows and Why They Change Your Numbers
Amazon attributes a sale to an ad clicked up to seven days earlier. This means that if two tools have different attribution windows, the same ad spend can be assigned to different days and sometimes even different products. So, you could spend $5,000 on ads in a month and notice a varying ACoS depending on which dashboard you check.
FBA Fee Timing and When Trackers Record Charges
When it comes to referral and fulfillment fees, different tools can date them differently. For a single unit, it might just be a few cents, which isn’t a big deal. But when you’re moving thousands of units each month, those discrepancies can add up to a significant amount, showing up in the wrong reporting period.
How Each Tool Handles Aged Inventory Surcharges
Amazon charges escalating fees on stock sitting past 180 days. Some tools spread that cost smoothly across the month; others book the whole spike on the day Amazon charges it. Although the fees are the same, the two monthly profit and loss statements (P&Ls) can end up looking completely different.
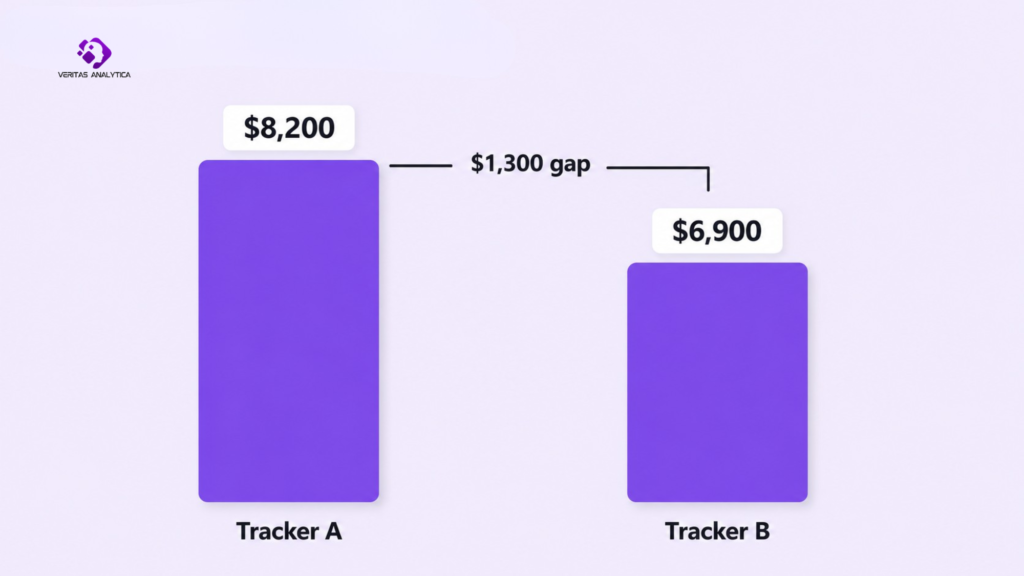
A quick example to make it real. Let’s say in April, your store did $40,000 in sales and spent $6,000 on ads. Amazon also charged a $1,300 long-term storage fee on inventory that had just crossed the 180-day mark. Tracker A spreads that one-time charge back across the months the stock actually sat, so almost none of it lands in April, and it reports a profit of $8,200. Tracker B books the full $1,300 in April, the month Amazon actually took the money, and reports $6,900. The business didn’t change. The whole gap comes down to a single accounting choice: when to record one fee. And if you only ever see one of those numbers, you might raise prices, cut ads, or delay a reorder based on a figure that would look very different in another tool.
Underneath all five sits a bigger issue. Amazon’s fee structure has more than a dozen separate charges (referral, fulfillment, storage, inbound placement, the aged-inventory surcharge, returns processing, low-inventory fees, and more), and a lot of them are buried deep in settlement reports that most sellers never open, let alone check line by line (Feedvisor, 2026). Trackers differ in how many of these they pick up and how they sort them. Whatever a tool misses won’t show up as an error. It just leaks out of your margin somewhere you’re not looking.
This matters more in 2026 than it did a year ago. Back on January 15, Amazon raised FBA fulfillment fees by an average of $0.08 a unit, and by as much as $0.51 a unit on smaller items priced above $50 (Amazon, 2026; Supply Chain Dive, 2025). On a SKU that was already thin, that can be the line between making money and losing it, and you’ll only catch it in time if your tracker is booking the right fees.
Sellerboard vs Helium 10 Profits vs Profit Cyclops: Head-to-Head Breakdown
Sellerboard: Accuracy, Features, and Best-Fit Use Cases
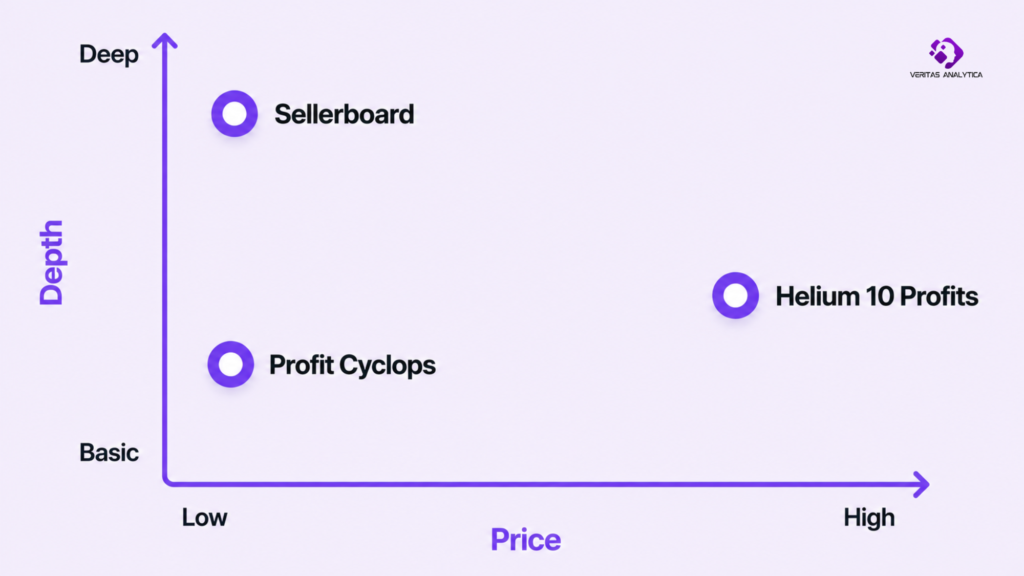
Sellerboard is the one most budget-minded sellers land on, and price is a big reason. It’s $19 a month for Standard, $29 for Professional, $39 for Business, and $79 for Enterprise, dropping to around $15 if you pay yearly. The plans are set by how many orders you do rather than by features, at roughly 3,000, 6,000, 15,000, and 50,000 orders a month (RevenueGeeks, 2026).
What you get is a real profit tool, not just a revenue screen: per-product P&L, PPC profit split out by campaign, proper cost-of-goods tracking (FIFO included), a breakdown of what returns are really costing you, and a reimbursement tool that finds lost or damaged stock you can claim back from Amazon. It covers Walmart, too, if you sell there.
It also plays well with the rest of your stack. It syncs directly to QuickBooks for your books, tracks Walmart, eBay, and Shopify sales in the same dashboard, and pulls real shipping costs in from ShipStation. That reach is a big part of why it stays competitive, not just the low price.
Where it falls short is the top end. Its multi-account handling is weaker than the enterprise platforms, so it fits a solo seller or single brand far better than an agency trying to manage ten accounts at once.
Helium 10 Profits: How Accurate Is It as a Standalone Tracker?
If you already pay for Helium 10, you already have profits. It’s included in every paid plan. That’s the whole case for it.
The catch in 2026 is what “already pay for Helium 10” costs you. Helium 10 retired its Starter plan in April 2026, so the cheapest paid tier is now Platinum at $129/month ($99 annual), with Diamond at $359/month ($279 annual). There’s no longer a cheap door into the suite, so “Profits is free with my plan” really means “free on top of $129 a month.”
As for the tool itself, it pulls orders, units, promotions, refunds, revenue, profit, margin, and total cost for each product into one dashboard (Helium 10, 2026), and it handles that well enough. But it’s one feature inside a suite of around thirty tools built mainly for research, not a profit tracker built from the ground up. As a quick number to glance at next to the keyword and product research you’re paying for anyway, it’s fine. The moment you want to dig deeper, you’ll want a different kind of tool.
Profit Cyclops: What It Does Differently and Who It’s For
Profit Cyclops competes with Sellerboard on the same ground, a real profit tracker at a low price, and undercuts it on cost. Pricing is advertised from around $1.99 per month to start, with tiers set by your monthly revenue rather than order count, running from under $5K in sales up past $2M. The feature list is broad for the price: per-ASIN and per-parent P&L, COGS management, an FBA reimbursements tool, returns analysis, an ad-performance dashboard, and inventory forecasting. On the accounting side, its companion Accounting Cyclops module syncs to QuickBooks, Xero, and Sage. It’s actively developed, with recent TikTok Shop and Walmart tie-ins and a wide range of international marketplaces.
The downsides are worth taking seriously, though. There isn’t much of an independent track record to go on. It has only a handful of reviews on Trustpilot and Capterra, including a 2025 complaint about a cheap trial that led to a larger-than-expected charge once monthly revenue exceeded a plan limit. Reviewers who’ve run it next to Sellerboard also found it slower to refresh and lighter on support and setup. None of that makes it a bad tool. It’s a real, cheaper option, and it makes the most sense for newer or budget-conscious sellers who want the basics without Sellerboard’s price or its slightly steeper learning curve.
Side-by-Side Comparison: Sellerboard vs Helium 10 Profits vs Profit Cyclops
Here are the three side by side, including the integration question that often settles the purchase, since most sellers want their profit tool to talk to their accounting software and whatever non-Amazon channels they run.
| Sellerboard | Helium 10 Profits | Profit Cyclops | |
|---|---|---|---|
| Entry Price | $19/mo ($15 annual) | Included in H10 (from $129/mo) | From ~$1.99/mo |
| Profit Depth | Per-SKU P&L, FIFO COGS | Profit dashboard inside a research suite | Per-ASIN P&L, COGS, returns |
| Accounting Software | QuickBooks | None native | QuickBooks, Xero, Sage |
| Marketplaces Beyond Amazon | Walmart, eBay, Shopify | Walmart, TikTok Shop | Walmart, TikTok Shop |
| Best For | Profit-first sellers | Existing H10 users | New / budget sellers |
| Weakness | Lighter multi-account | Not a standalone tracker | Slower refresh, thin support |
Pricing verified June 2026.
The Feature Overlap Most Amazon Sellers Are Paying for Twice
There’s a cost here that almost nobody adds up. Plenty of sellers run Helium 10 for research and Sellerboard for profit, and the moment you do, you’re paying for profit tracking twice. Once inside the $129 Helium 10 plan, and again at $19 for Sellerboard.
On its own, that might be fine. They’re good at different things. The expensive part is what comes next. The two will still disagree, for all the reasons above, so now you’ve paid for two profit numbers and given yourself a weekly job of deciding which one to trust.
And that’s the bigger story of the modern seller stack. Your research tool, profit tracker, inventory tool, and ad tool each hold a piece of the truth, and none of them talk to each other. Profit sits in one tab, ad spend in another, stock counts in a third, and the weekly spreadsheet you build to tie them together is basically a tax on running tools that don’t connect. Two trackers disagreeing isn’t really a glitch. It’s just what a disconnected setup looks like up close.
Which Amazon Profit Tracker Should You Actually Use? (Decision Guide)
Choose based on what you actually need the profit number to do, not on which tool has the longest feature list.
If You’re a Solo Seller and Profit Accuracy Is Your Top Priority → Sellerboard
Sellerboard. For $15 to $19 a month, you get a really detailed profit picture, FIFO costing, and a reimbursement tool that digs up money Amazon owes you for lost or damaged stock. For most people reading this, it’s the obvious place to start.
If You Already Use Helium 10 for Research → Helium 10 Profits
You’re paying for it anyway, and for catching unprofitable SKUs and keeping an eye on margin, it does the job. Only look for a dedicated tracker once you’re making real money decisions off that number and want more depth than a bundled tool can give.
If You’re Just Starting Out or on a Tight Budget → Profit Cyclops
Look at Profit Cyclops. It’s the cheapest real tracker of the three and covers the basics. Given the limitations mentioned in the article above, use that $1.99 first month to test it properly before you trust it with your reporting
Bottom Line: The Right Amazon Profit Tracker Depends on How You Sell
If there’s one thing to take from all this, pick a profit definition you trust, then stick with a single tool for your decisions. Jumping between three dashboards and averaging them in your head is worse than living with one steady number, even an imperfect one. Which tool you pick matters less than picking one and staying with it.
Frequently Asked Questions
Why Does My Amazon Profit Look Different in Every Tracker?
Each one defines profit a little differently, mostly in how it books returns, applies the cost of goods, and attributes ad spend. No single tool is wrong. They’ve just made different accounting choices. The answer is to pick one and treat its number as your source of truth.
Is Helium 10 Profits accurate enough on its own?
For spotting losing SKUs and tracking margin at a glance, yes. For precise net-profit decisions, it’s lighter than a tool built only for profit tracking. Treat it as a sanity check, not your accounting backbone.
Do You Need a Separate Amazon Profit Tracker If You Already Use Helium 10?
Not at first. Profits is included in your plan. Add a dedicated tool like Sellerboard once profit accuracy is driving real pricing and inventory decisions, and you want more detailed analysis than the bundled tool offers.